
Quick overview about placement groups within Ceph.
Placement groups provide a means of controlling the level of replication declustering.
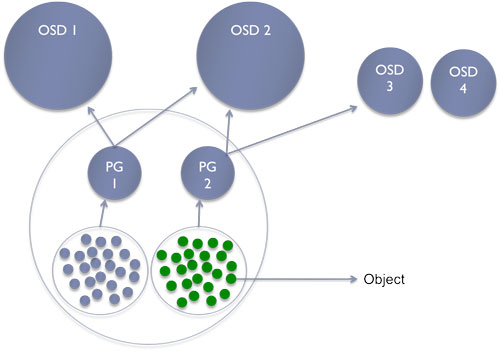
The big picture:
Roughly:
- Pool contains objects
- Pg: placement group contains objects within a pool
- One object belongs to only one pg
- Pg belongs to multiple OSDs
Placement groups offer better balance inside your cluster. I don’t need to remember you that everything is build on top of RADOS in Ceph. So basically let’s analyse, how objects are stored:
First create a dedicated pool:
$ rados mkpool test
List of my current pools:
$ rados lspools
data
metadata
rbd
pool
test
In Ceph, each pool is numbered incrementally. First pool has 1 as ID and so on. I have 4 pools, this ID of my latest pool is 4. This can be confirmed by this command:
$ ceph osd lspools
0 data,1 metadata,2 rbd,3 pool,4 test,
Fullfil your pool a bit with an object:
$ dd if=/dev/zero of=my-object bs=10M count=1
1+0 records in
1+0 records out
10485760 bytes (10 MB) copied, 0.0763588 s, 137 MB/s
$ rados -p test put my-object my-object
$ rados -p test stat my-object
test/my-object mtime 1348960511, size 10485760
Where is my object?
$ ceph osd map test my-object
osdmap e260 pool 'test' (4) object 'my-object' -> pg 4.c5034eb8 (4.0) -> up [8,0] acting [8,0]
This command returns useful information like:
- my object
my-objectbelongs to the pg number 4 - this object is currently stored into the OSD 8 and 0
You can check the content of the OSD filesystem:
$ ls -lh /srv/ceph/osd8/current/4.0_head/
total 11M
-rw-r--r-- 1 root root 10M Sep 26 07:15 my-object__head_C5034EB8__4
Without any surprise, the directory contains the same information returned by the command above.
A pg overview, I only get the info the test pool:
$ ceph pg dump | egrep -v '^(0\.|1\.|2\.|3\.)' | egrep -v '(^pool\ (0|1|2|3))' | column -t
dumped             all      in       format    plain
version            1633
last_osdmap_epoch  260
last_pg_scan       259
full_ratio         0.95
nearfull_ratio     0.85
pg_stat            objects  mip      degr      unf              bytes      log       disklog  state         state_stamp  v                reported  up      acting  last_scrub  scrub_stamp
4.3                0        0        0         0                0          0         0        active+clean  2012-09-26   06:58:44.147949  0'0       259'7   [8,4]   [8,4]       0'0          2012-09-26  06:58:44.147692
4.2                0        0        0         0                0          610       610      active+clean  2012-09-26   06:59:43.896101  260'5     259'14  [6,7]   [6,7]       0'0          2012-09-26  06:59:43.896046
4.1                0        0        0         0                0          0         0        active+clean  2012-09-26   06:59:44.803068  0'0       259'7   [5,2]   [5,2]       0'0          2012-09-26  06:59:44.803030
4.0                1        0        0         0                10485760   375       375      active+clean  2012-09-26   06:58:42.145333  260'3     259'11  [8,0]   [8,0]       0'0          2012-09-26  06:58:42.145061
4.7                0        0        0         0                0          0         0        active+clean  2012-09-26   06:58:39.331733  0'0       259'7   [2,4]   [2,4]       0'0          2012-09-26  06:58:39.331695
4.6                0        0        0         0                0          0         0        active+clean  2012-09-26   06:58:45.143504  0'0       259'7   [8,5]   [8,5]       0'0          2012-09-26  06:58:45.143254
4.5                0        0        0         0                0          512       512      active+clean  2012-09-26   06:59:46.809228  260'4     259'14  [5,8]   [5,8]       0'0          2012-09-26  06:59:46.809191
4.4                0        0        0         0                0          387       387      active+clean  2012-09-30   00:59:10.574117  260'3     259'11  [4,6]   [4,6]       0'0          2012-09-30  00:59:10.574060
pool               4        1        0         0                0          10485760  1884     1884
sum                102      0        0         0                413860224  17906     17906
osdstat            kbused   kbavail  kb        hb               in         hb        out
0                  600804   1486108  2086912   [1,2,4,5,6,7,8]  []
1                  611296   1475616  2086912   [0,2,3,4,7,8]    []
2                  615496   1471416  2086912   [0,1,3,4,5,6]    []
3                  561700   476636   1038336   [1,2,5,6,7,8]    []
4                  643628   394708   1038336   [1,2,5,6,8]      []
5                  747004   291332   1038336   [0,2,3,7,8]      []
6                  658020   380316   1038336   [0,2,3,4,7,8]    []
7                  660440   377896   1038336   [0,1,3,4,5,6]    []
8                  779068   259268   1038336   [0,1,3,4,5,6]    []
sum                5877456  6613296  12490752
You can see our fresh object in line 12 and you also notice that my pool has a replica count of 2, this can be confirmed via:
$ ceph osd dump | egrep ^pool\ 4
pool 4 'test' rep size 2 crush_ruleset 0 object_hash rjenkins pg_num 8 pgp_num 8 last_change 259 owner 18446744073709551615
If you want to go further you can also retrieve the pg statistics:
$ ceph pg 4.0 query

{ "state": "active+clean",
  "up": [
        8,
        0],
  "acting": [
        8,
        0],
  "info": { "pgid": "4.0",
      "last_update": "260'3",
      "last_complete": "260'3",
      "log_tail": "0'0",
      "last_backfill": "MAX",
      "purged_snaps": "[]",
      "history": { "epoch_created": 259,
          "last_epoch_started": 281,
          "last_epoch_clean": 281,
          "last_epoch_split": 276,
          "same_up_since": 280,
          "same_interval_since": 280,
          "same_primary_since": 280,
          "last_scrub": "0'0",
          "last_scrub_stamp": "2012-09-26 06:58:42.145061"},
      "stats": { "version": "260'3",
          "reported": "280'34",
          "state": "active+clean",
          "last_fresh": "2012-09-26 13:36:04.032048",
          "last_change": "2012-09-26 13:35:57.831527",
          "last_active": "2012-09-26 13:36:04.032048",
          "last_clean": "2012-09-26 13:36:04.032048",
          "last_unstale": "2012-09-26 13:36:04.032048",
          "mapping_epoch": 275,
          "log_start": "0'0",
          "ondisk_log_start": "0'0",
          "created": 259,
          "last_epoch_clean": 259,
          "parent": "0.0",
          "parent_split_bits": 0,
          "last_scrub": "0'0",
          "last_scrub_stamp": "2012-09-26 06:58:42.145061",
          "log_size": 375,
          "ondisk_log_size": 375,
          "stat_sum": { "num_bytes": 10485760,
              "num_objects": 1,
              "num_object_clones": 0,
              "num_object_copies": 0,
              "num_objects_missing_on_primary": 0,
              "num_objects_degraded": 0,
              "num_objects_unfound": 0,
              "num_read": 0,
              "num_read_kb": 0,
              "num_write": 3,
              "num_write_kb": 10240},
          "stat_cat_sum": {},
          "up": [
                8,
                0],
          "acting": [
                8,
                0]},
      "empty": 0,
      "dne": 0,
      "incomplete": 0},
  "recovery_state": [
        { "name": "Started\/Primary\/Active",
          "enter_time": "2012-09-26 13:35:57.631197",
          "might_have_unfound": [],
          "scrub": { "scrub_epoch_start": "259",
              "scrub_active": 0,
              "scrub_block_writes": 0,
              "finalizing_scrub": 0,
              "scrub_waiting_on": 0,
              "scrub_waiting_on_whom": []}},
        { "name": "Started",
          "enter_time": "2012-09-26 13:35:56.625867"}]}
K Visit those pages for further reading:
I hope this article gave a good comprehension of how ceph store the data :-). Some of you could think: how could you make an article about data placement without talking about CRUSH. I will simply answer: that’s will be part of a future article.